Keeping on top of paper packaging prices is no easy feat. Prices can easily be influenced by many factors, from the supply and demand trends to the cost to produce your product. In addition, macroeconomic influences such as inflation, geopolitical events, supply chain challenges and policy changes can also have an impact on prices.
In this article, we will take you through what makes up the cost of a paper packaging product and demonstrate how the price of your product can change quickly over time using price and cost indices.
What makes up the cost to produce a paper packaging product?
To simplify, the cost to produce paper packaging can generally be separated into three broad categories:
- The cost of the paperboard used as the base material for the paper packaging. This can differ depending on the type of packaging you are making (e.g. corrugated packaging and folding carton would use different base material).
- The conversion process of making the paperboard into paper packaging. This can differ between each producer and their mill setup (e.g. machines used and production efficiency).
- Overheads, profits and other costs not included in the above.
The largest and most variable cost for producing paper packaging is in the paperboard material that makes up the bulk of the product. Changes in the value of the paperboard material can be estimated by using:
- The market price at which the paperboard is sold. Generally, the higher the market price at which the paperboard is sold, the more it will contribute to the cost of the final box. The market price is influenced by market conditions at the time (i.e. supply and demand of the paperboard).
- The cost to produce the paperboard. Generally, the more expensive it is to produce the paperboard, the higher price the paperboard should be sold at. This will influence your final box price.
By modelling the market price of the paperboard and the cost to produce the paperboard, we can work out how paper packaging prices should evolve over time.
Modelling paper packaging cost evolution with price and cost indices
Our index builder model calculates how the cost of producing the paper packaging should have evolved in relation to the changes in the two factors mentioned above – the market price of the paperboard material using our price data (the price index) and the cost to produce the paperboard material based on information from our cost benchmarking tool, Analytical Cornerstone (the cost index).
In our example, we will demonstrate the volatility in prices and costs by focusing on the cost evolution of corrugated packaging in Europe using two types of containerboard – recycled liner and recycled medium – as the paperboard material and a starting point of EUR100 per 1000 pieces from 2020 to 2023.

Looking at the market price of containerboard (price index)

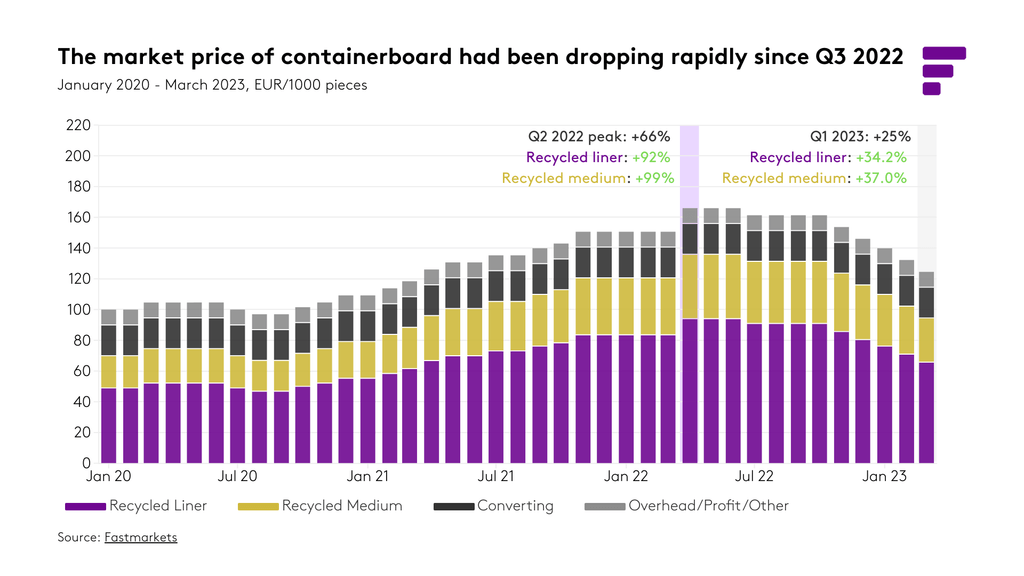
Firstly, the model shares a chart that demonstrates how the cost to make the corrugated box has changed based on the market price of the containerboard base material.
It shows that containerboard prices had steadily increased from Q4 2020 and peaked in Q2 2022 at €165.95 per 1000 boxes, with both recycled liner and recycled medium almost doubling in price compared to 2020. The prices somewhat held on through Q3 and fell very quickly again from Q4 onwards, dropping to only €124.54 per 1000 boxes in Q1 2023.
The peak in prices in early 2022 was driven by a tight market where the demand for all grades was strong and mills tried to secure limited supply. This had eased in the latter part of the year with a combination of soaring inflation, weakened demand, uncertainty surrounding the war in Ukraine and the prospect of an energy crisis driving the downward trend in prices.
Looking at the cost to produce containerboard (cost index)

The next chart produced by the model demonstrates how the cost to make the corrugated box has changed based on the cost to produce the containerboard base material. The model takes into account the main cost drivers in a containerboard mill, including fiber, energy, labor, chemicals and others.
The cost to produce the containerboard had increased significantly over this time period, peaking in Q3 2022 at €287.43 per 1000 boxes. However, this had U-turned dramatically in the next quarter and dropped to just €221.72 per 1000 boxes, just over double the cost from the start of 2020.
The main contributors to the dramatic rise and fall in production costs were identified to be energy and fiber. We can delve further into the model to find out what happened here.

Here the model focuses on how energy prices had evolved in this time period and takes into account nine different types, including biofuels, coal, electric, natural gas and others.
At its peak in Q3 2022, the cost had gone from €30.86 to €139.68 per 1000 boxes. The biggest contributor was natural gas, which had seen its cost grow by almost fivefold since 2020. However, by Q4 2022, energy has dropped to €121.68 per 1000 boxes and natural gas has reduced to just over four times the cost compared to 2020.
This reflects the nature in which European paper packaging companies are heavily dependent on natural gas to power their mills. When prices shot up significantly over the last year due to inflation and the war in Ukraine, it drastically increased the production costs of paper packaging products. Energy prices have lowered and stabilized since the peak of the energy crisis, resulting in the drop in production costs we see here.

On the fiber side, the model takes into account four different types of fiber, including old corrugated containerboard (OCC), mixed paper and board (P&B) and others.
Fiber cost leaped in the first half of 2022 and had increased more than fivefold from €15.24 in 2020 to €86.39 per 1000 boxes in Q2 2022. The biggest contributor to this increase was OCC, which had seen its cost contribution increase dramatically at +464%. The slump in fiber costs came abruptly in the next quarter, with the overall cost dropping to €36.32 per 1000 boxes and OCC prices reducing to only +131% from 2020. This downward trend continued in Q1 2023.
These trends match up with the dramatic price changes for OCC we had seen in the past year. Strong demand in the earlier half of 2022 caused the prices to peak at all-time highs, but by the time we got to the latter half of the year, the prices had plummeted with the disappearance of demand.
Comparing the cost to produce with the market price

The last chart from the model brings together the cost and price indices.
It shows that the cost to produce containerboard had risen more than the market prices at which the containerboard had been sold in Q2 to Q3 2022. The largest difference between the two indices was in July 2022, when the cost index was at approximately +287% while the price index was at approximately +161%. At this point, integrated box producers’ margins were squeezed as the input costs were high.
The markets turned very shortly after and both the cost and price indices had started to go on a downward path by Q3 and Q4 2022, thus easing cost pressures for producers.
Take a closer look at what happened to paper packaging prices in 2022 here.
Using index models to help you make informed business decisions
The dramatic changes we had seen in the cost evolution model happened in the space of six months. Not only does it demonstrate the volatility in our markets today, but it also points out why it is imperative for all players in the market to keep on top of the fluctuations in prices and their drivers.
The global economy has shown more resilience in 2023, but the threat of recession, the worsening of the energy crisis, the war in Ukraine and the uncertainty surrounding supply and demand conditions for paper packaging can still turn the tables in the near future.
Our index builder model is a useful tool for you to monitor these changes and understand how prices could evolve. It combines our trusted and benchmarked price data with our industry-leading mill intelligence database and allows you to set up the model to closely resemble your ‘real-life’ scenario. This can provide you with insights into what factors are influencing the price of your paper packaging product, bring more transparency to your supplier/buyer relationship, help you justify prices at the negotiating table and make sure you are paying the right price for your products.
Speak to our team to schedule a demo or find out more about how our cost analysis products can help you.


